
Measuring Motion Using a Ticker Timer
This is a lesson summary. The full lesson can be viewed by purchasing an online course subscription.
Learning Objective
In this lesson we will learn how to record the motion of an object using a ticker timer, and how to interpret the data.
Learning Outcomes
By the end of this lesson you will be able to:
- Describe how a ticker timer works.
- Explain how to measure the average speed of an object using a ticker timer.
- Explain how to measure the average acceleration of an object using a ticker timer.
- Describe how to graph the data recorded by a ticker timer.
- Explain how to interpret a graph produced from ticker timer data.
- Describe experiments that can be conducted using ticker timers.

(Image: vinsky2002, Pixabay)
Lesson Summary
- A ticker timer is a small electronic device designed to record the linear motion of an object.
- It consists of a vibrating arm which records a dot every 0.02 seconds on a piece of paper tape attached to a moving object.
- The spacing between the dots on ticker timer tape gives an indication of how fast the object was travelling.
- If the dots are far apart, the object moved at a high speed.
- If the dots are close together, the object moved at a low speed.
- The spacing between the dots on ticker timer tape also gives an indication of how the object’s speed changed over time.
- If the dots are evenly spaced, the object moved at a constant speed.
- If the dots become further apart, the object increased speed.
- If the dots become closer together, the object decreased speed.
- On a piece of ticker timer tape, the progression of time is in the opposite orientation to the direction of motion.
- The average speed of an object can be calculated by dividing the distance between the first and last dots by the time, where time equals the number of intervals multiplied by 0.02 s.
- The average acceleration of an object can be calculated by dividing the change in speed between the first and last intervals by the time, where time equals the number of intervals from the middle of the first interval to the middle of the last interval multiplied by 0.02 s.
- The data produced by a ticker timer can be used to construct a distance-time graph.
- Two common experiments that can be conducted using ticker timers are:
- Recording the motion of an object moving down a slope due to gravity.
- Recording the motion of an object that is being dragged along a flat surface by an object that is falling due to gravity.
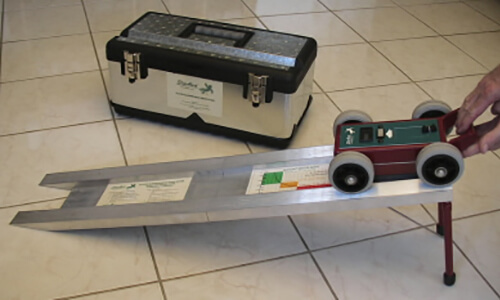
(Image: Jack Trumpet, Wikimedia Commons)