
Distance-Time Graphs and Displacement-Time Graphs
This is a lesson summary. The full lesson can be viewed by purchasing an online course subscription.
Learning Objective
In this lesson we will learn how changes in distance and displacement can be represented graphically.
Learning Outcomes
By the end of this lesson you will be able to:
- Describe the layout of a distance-time graph.
- Describe how constant speed, changing speed and stationariness are represented on a distance-time graph.
- Describe the relationship between the gradient of the line on a distance-time graph and speed.
- Calculate instantaneous speed and average speed from a distance-time graph.
- Compare distance-time graphs and displacement-time graphs.

(Image: monikawl999, Pixabay)
Lesson Summary
- A distance-time graph plots the distance travelled by an object (on the y-axis) against time (on the x-axis).
- Distance-time graphs can show:
- Stationariness – a horizontal line (zero gradient).
- Constant speed – a straight line with a positive gradient.
- Increasing speed (acceleration) – a curved line that rises with an increasing gradient as time progresses.
- Decreasing speed (deceleration) – a curved line that rises with a decreasing gradient as time progresses.
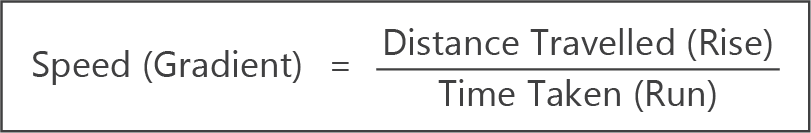
- The gradient of the line on a distance-time graph represents speed, which can be calculated using the formula:
- Instantaneous speed is given by the gradient at a particular time point.
- It is the gradient of a tangential line drawn through that time point on the graph line.
- Average speed is given by the gradient between two time points.
- It is the gradient of a line drawn between the two time points on the graph line.
- The steeper the slope of the line on a distance-time graph, the greater the speed.
- A displacement-time graph plots the displacement of an object (on the y-axis) against time (on the x-axis).
- Displacement-time graphs can show:
- Stationariness – a horizontal line (zero gradient).
- Constant positive velocity – a straight line with a positive gradient.
- Constant negative velocity – a straight line with a negative gradient.
- They can also show increasing and decreasing velocity in the forward and reverse directions.

(Image: 12019, Pixabay)
(Header image: Martin, Adobe Stock)